Near term U.S. 10-Year note yield outlook:
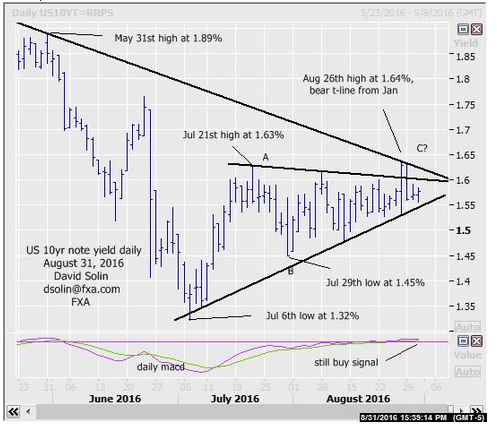
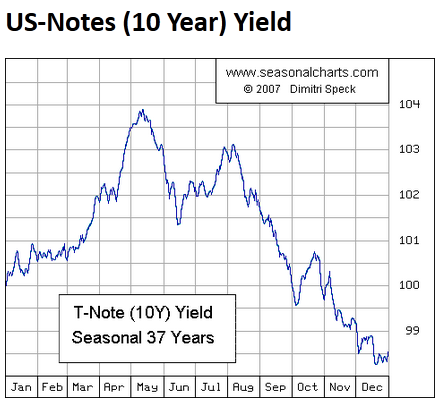
In the Aug 25th email, affirmed the viewed of gains above the July 21st high at 1.63%, but warned that the "pivotal", longer term bearish trendline from Jan was just above there. The market did indeed break above 1.63% the next day, reaching 1.64% (testing that trendline from Jan) and before quickly reversing back below. Lots of negatives argue a top and with potential declines back toward that Jul 6th low at 1.32% and even below (but as part of a longer term bottoming, see longer term below). Note that the failure/false break of that July high at 1.63%, potential completion of the 3 wave (A-B-C) rally from the Jul 6th low, stalling technicals and the seasonal chart that is lower into the end of the year (see 3rd chart below) all add to this top view. Key resistance remains at the long discussed "pivotal" bearish trendline from Jan (currently at 1.63/67%, break/close above would argue that a more important low is already in place, and that Jul high). Nearby support is seen at the bullish trendline from early July (currently at 1.53/55%) and 1.43/45% (Jul 29th low, 62% from the 1.32% low). Bottom line: remaining below that key, bearish trendline from Jan argues declines back toward 1.32% as part of a larger bottoming.
Strategy/position:
With potential of that topping, would sell here (currently at 1.58%) and initially stopping on a close .03 above that bearish trendline from Jan (limited risk). However, with the downside likely rangy and part of a larger bottoming (see longer term below), will want to get more aggressive on nearby weakness to maintain a good risk/reward in the position.
Long term outlook:
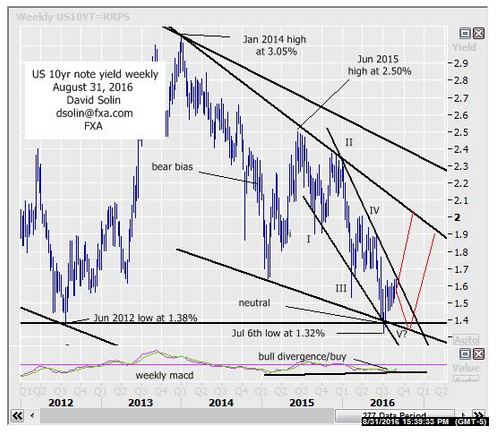
No change in the long term as the market is seen in process of an important bottoming (for at least 6-9 months) after finally achieving that very long term target (years) below the June 2012 low at 1.38% (reached 1.32% on July 6th). Lots of long term positives add to the larger bottoming view and include the false break of that 1.38% low, bullish technicals (see bull divergence/buy mode on the weekly macd), and potential completion (or nearly) of the 5 wave decline from at least the Jun 2015 high at 2.50% (wave V). However as been discussing, there remains scope for a more extended period of basing as part of the process (see in red on weekly chart/2nd chart). Key resistance remains at that long discussed, "pivotal" bearish trendline from Jan, as a break/close above would greatly increase the likelihood that a more significant low in price is finally in place. Bottom line : a more major bottoming is favored (low for 6-9 months) but with scope for a more extended period of ranging/basing as part of the process.
Strategy/position:
With the market still below that "pivotal" trendline from Jan and potential for further lows, would also switch the longer term bias to bearish here (currently at 1.58%) and then using the same exit as the shorter term above (limited risk). Though substantial declines from here are not favored (versus limited downside as part of a larger term bottoming), there is the potential and would prefer to make that reassessment from a position of strength/lower levels (assuming the nearer term declines).
Current:
Nearer term : resold Aug 31 at 1.58% and stopping on close .03 above that pivotal bear t-line from Jan.
Last : resold Jun 22 at 1.69%, took profit Jun 23 above top of wedge (1.38% for .31 profit).
Longer term: bear bias Aug 31 at 1.58%, but downside likely part of a more major bottoming.
Last : bullish bias Aug 5th at 1.57% to neutral Aug 10th 1.51%.


